Eclipse MicroProfile Metrics, practical use cases
31 October 2018
Background
At the end of 2000 decade, one of the main motivations for DevOps creation was the (relatively speaking) neglected interaction between development, QA and operations teams.
In this line, the "DevOps promise" could be summarized as the union between culture, practices and tools to improve software quality and, at the same time, to speed up software development teams in terms of time to market. Winning in many successful implementations colateral effects like scalability, stability, security and development speed.
In line with diverse opinions, to implement a successful DevOps culture IT teams need to implement practices like:
- Continuos integration (CI)
- Continuos delivery (CD)
- MicroServices
- Infrastructure as code
- Communication and collaboration
- Monitoring and metrics
In this world of buzzwords it's indeed difficult to identify the DevOps maturity state without losing the final goal: To create applications that generate value for the customer in short periods of time.
In this post, we will discuss about monitoring and metrics in the Java Enterprise World, specially how the new DevOps practices impact the architectural decision at the technology selection phase.
Metrics in Java monoliths
If traditional architectures are considered, monolithic applications hold common characteristics like:
- Execution over servlet containers and application servers, with the JVM being a long running process.
- Ideally, these containers are never rebooted, or reboots are allowed on planned maintenance Windows.
- An application could compromise the integrity of the entire monolith under several conditions like bad code, bad deployments and server issues.
Without considering any Java framework, the deployment structure will be similar to the figure. In here we observe that applications are distributed by using .war or .jar files, being collected in .ear files for management purposes. In these architectures applications are created as modules, and separated considering its business objectives.
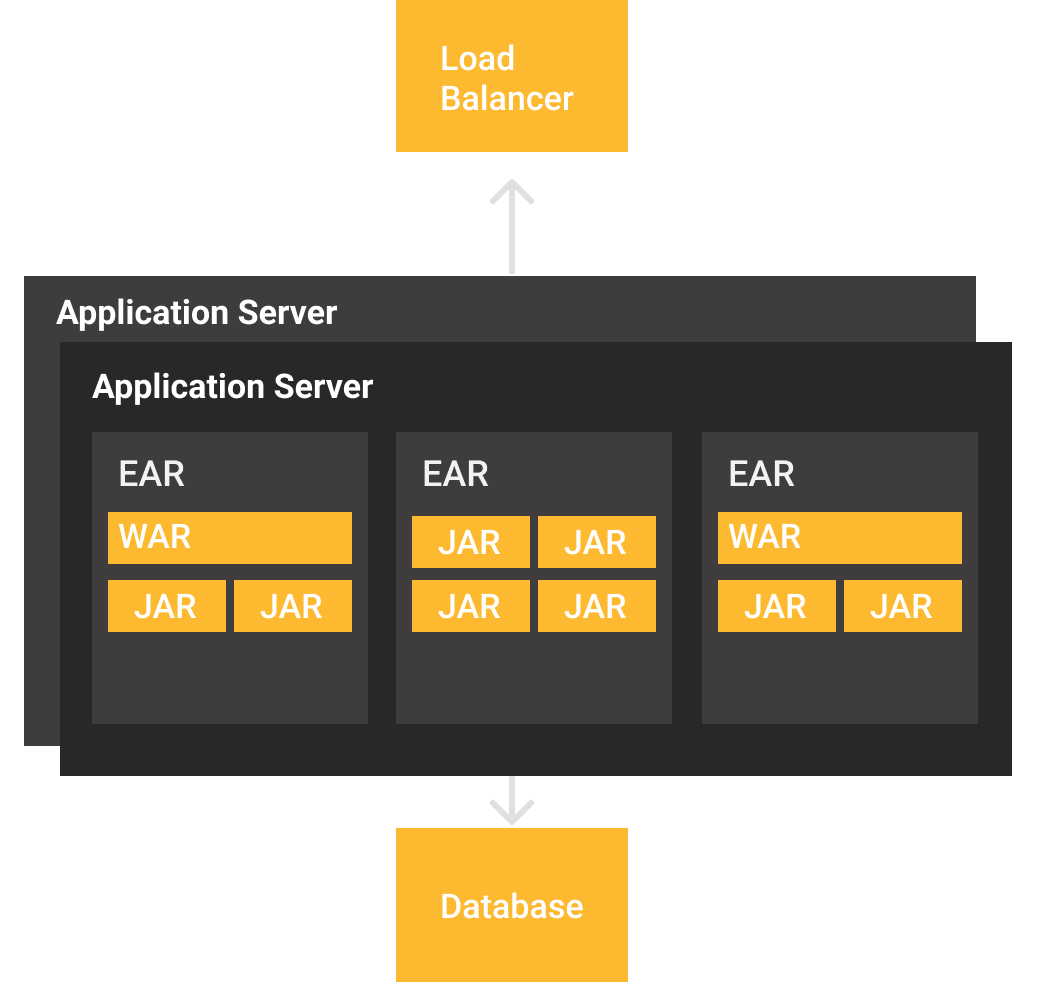
If a need to scale appears, there are basically two options, 1- to scale server resources (vertical) and 2- to add more servers with an application copy to distribute clients using a load balancer. It is worth to notice that new nodes tend to be also long running processes, since any application server reboot implies a considerable amount of time that is directly proportional to the quantity of applications that have been deployed.
Hence, the decision to provision (or not) a new application server often is a combined decision between development and operations teams, and with this you have the following options to monitor the state of your applications and application server:
- Vendor or vendor-neutral telemetric APIs -e.g Jookla, Glassfish REST Metrics-
- JMX monitoring through specific tools and ports -e.g. VisualVM, Mission Control-
- "Shell wrangling" with tail, sed, cat, top and htop
It should be noticed also, in this kind of deployments it's necessary to obtain metrics from application and server, creating a complex scenario for status monitoring.
The rule of thumb for this scenarios is often to choose telemetric/own APIs to monitor application state and JMX/Logs for a deeper analysis of runtime situation, again presenting more questions:
- Which telemetric API should I choose? Do I need a specific format?
- Server's telemetry would be sufficient? How metrics will be processed?
- How do I got access to JMX in my deployments if I'm a Containers/PaaS user?
Reactive applications
One of the (not so) recent approaches to improve users experience is to implement reactive systems with the defined principles of the Reactive Manifesto.
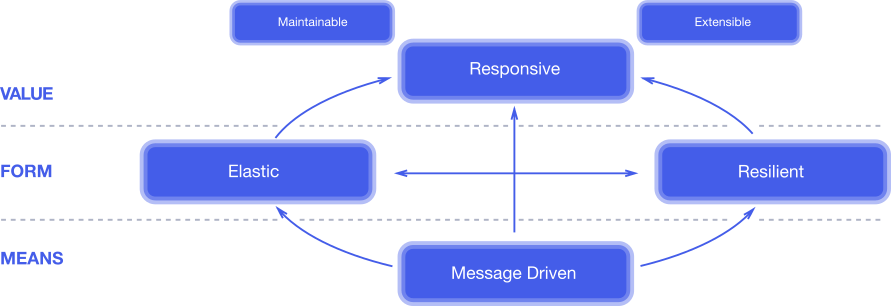
In short, a reactive system is a system capable of:
- Being directed/activated by messages often processed asynchronously
- Presents resilience by failing partially, without compromising all the system
- Is elastic to provision and halt modules and resources on demand, having a direct impact in resources billing
- The final result is a responsive system for the user
Despite not being discussed so often, reactive architectures have a direct impact on metrics. With dynamic provisioning you won't have long running processes to attach and save metrics, and additionally the services are switching ip addresses depending on clients demand.
Metrics in Java Microservices architectures
Without considering any particular framework or library, the reactive architectural style puts as strong suggestion the usage of containers and/or Microservice, specially for resilience and elasticity:
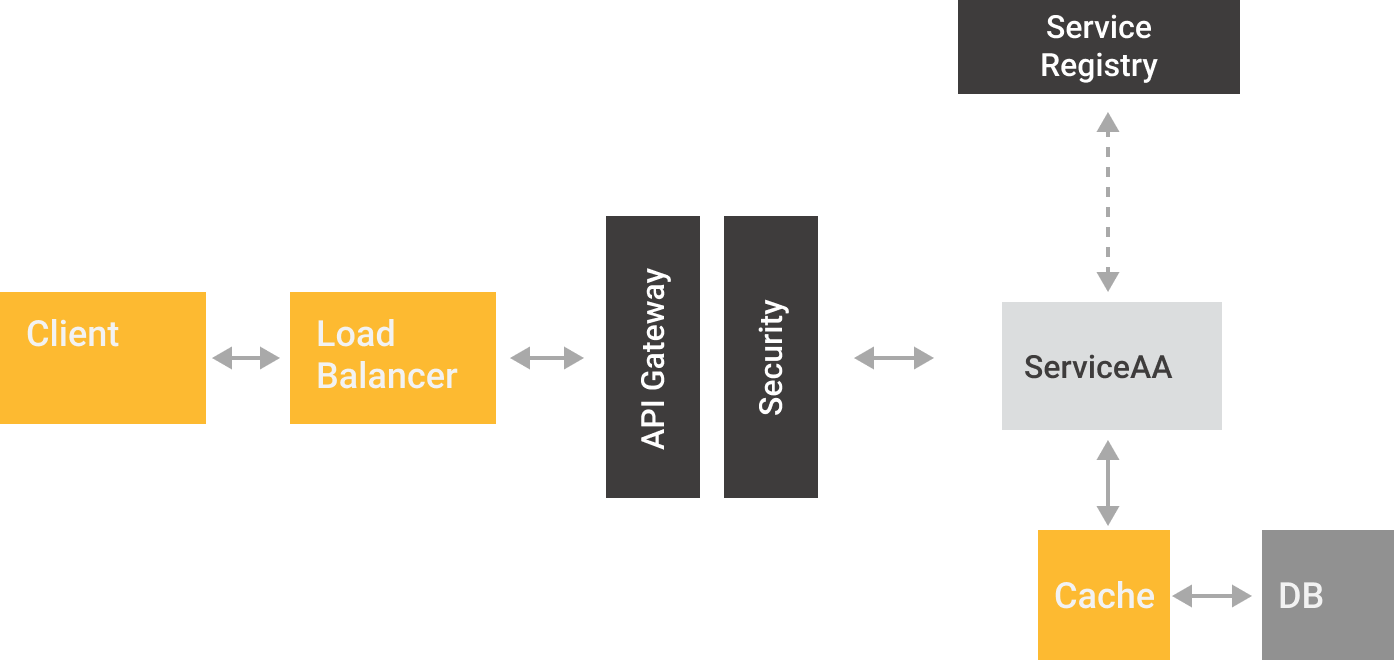
In a traditional Microservices architecture we observe that services are basically short-lived "workers", which could have clones reacting to changes on clients demand. These environments are often orchestrated with tools like Docker Swarm or Kubernetes, hence each service is responsable of register themself to a service registry acting as a directory. Being the registry, the ideal source for any metric tool to read services location, pulling and saving the correspondent metrics.
Metrics with Java EE and Eclipse MicroProfile
Despite the early efforts on the EE space like an administrative API with metrics, the need of a formal standard for metrics became mandatory due Microservices popularization. Being Dropwizard Metrics one of the pioneers to cover the need of a telemetric toolkit with specific CDI extensions.
In this line, the MicroProfile project has included among its recent versions(1.4 and 2.0) support for Healthcheck and state Metrics. Many of the current DropWizard users would notice that annotations are similar if not the same. In fact MicroProfile annotations are based directly on DropWizard's API 3.2.3.
To differentiate between concepts, Healtheck API is in charge of answering a simple question "Is the service running and how well is it doing it?" and are targeted for orchestrations. On the other side Metrics present instant or periodical metrics on how services are reacting over consumers requests.
Latest version of MicroProfile (2.0) includes support for Metrics 1.1, including:
- Counted
- Gauge
- Metered
- Timed
- Histogram
So, it is worth to give them a try with practical use cases.
Metrics with Payara and Eclipse MicroProfile
For the test we will use an application composed by two microservices, as described in the diagram:
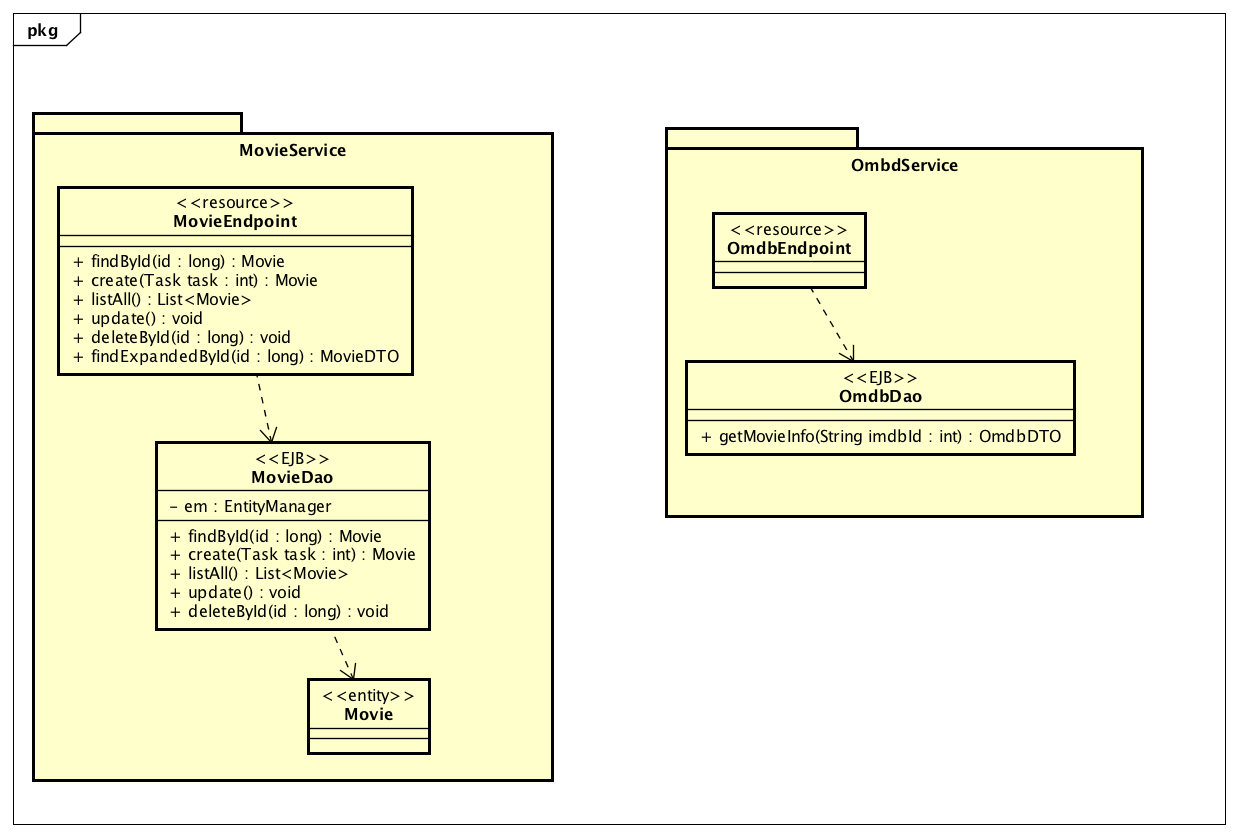
Our scenario includes two microservices, OmdbService focused on information retrieving from OMDB to obtain up to date movie information and MovieService aimed to obtain movie information from a relational database and mix it with OMDB plot. Projects code is available at GitHub.
To activate support for MicroProfile 2.0 two things are needed, 1- the right dependency on pom.xml and 2- to deploy/run our application over a MicroProfile compatible implementation, like Payara Micro.
<dependency>
	<groupId>org.eclipse.microprofile</groupId>
	<artifactId>microprofile</artifactId>
	<type>pom</type>
	<version>2.0.1</version>
	<scope>provided</scope>
</dependency>
MicroProfile uses a basic convention in regards of metrics, presenting three levels:
- Base: Mandatory Metrics for all MicroProfile implementations, located at
/metrics/base - Application: Custom metrics exposed by the developer, located at
/metrics/application - Vendor: Any MicroProfile implementation could implement its own variant, located at
/metrics/vendor
Depending on requests header, metrics will be available in JSON or OpenMetrics format. The last one popularized by Prometheus, a Cloud Native Computing Foundation project.
Practical use cases
So far, we've established that:
- You could monitor your Java application by using telemetric APIs and JMX
- Reactive applications present new challenges, specially due microservices dynamic and short running nature
- JMX is sometimes difficult to implement on container/PaaS based deployments
- MicroProfile Metrics is a new proposal for Java(Jakarta) EE environments, working indistinctly for monoliths and microservices architectures
In this post we present a couple of cases discussed also at Oracle Code One:
Case 0: Telemetry from JVM
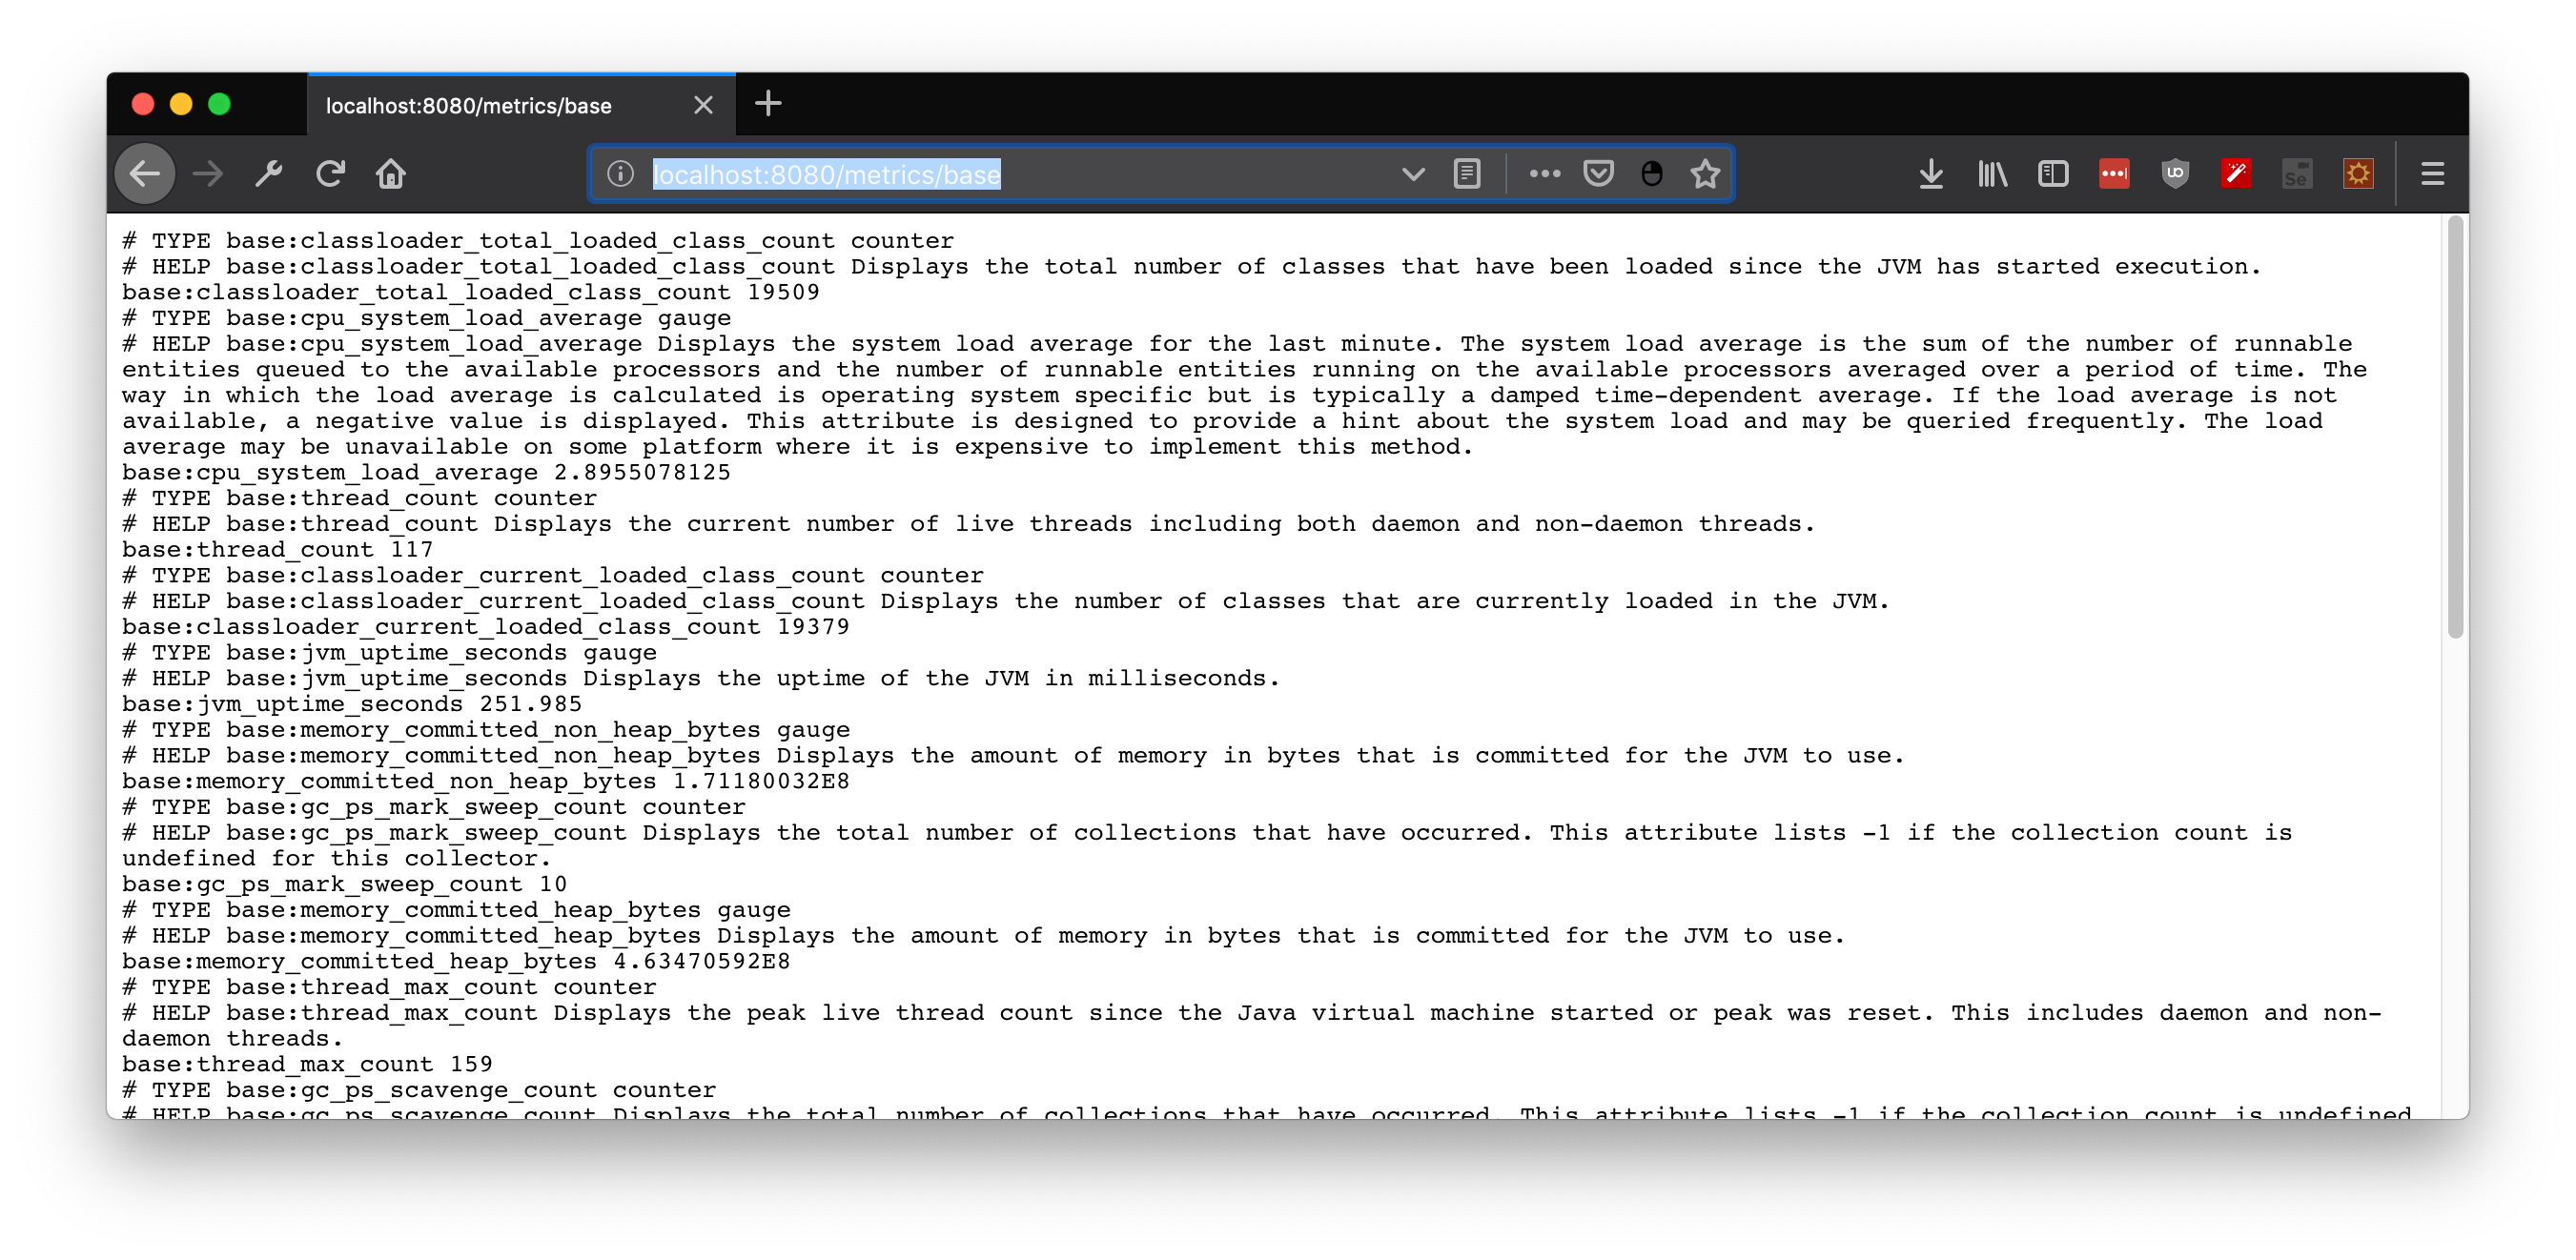
To give a quick look on MicroProfile metrics, it is enough to boot a MicroProfile compliant app server/microservice framework with any deployment. Since Payara Micro is compatible with Microprofile, metrics will be available from the beginning at http://localhost:8080/metrics/base.
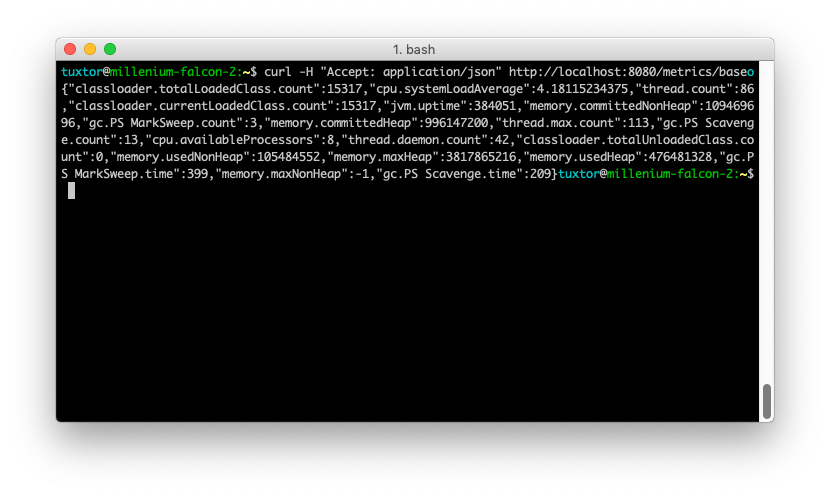
You could switch the Accept request header in order to obtain JSON format, in curl for instance:
curl -H "Accept: application/json" http://localhost:8080/metrics/base
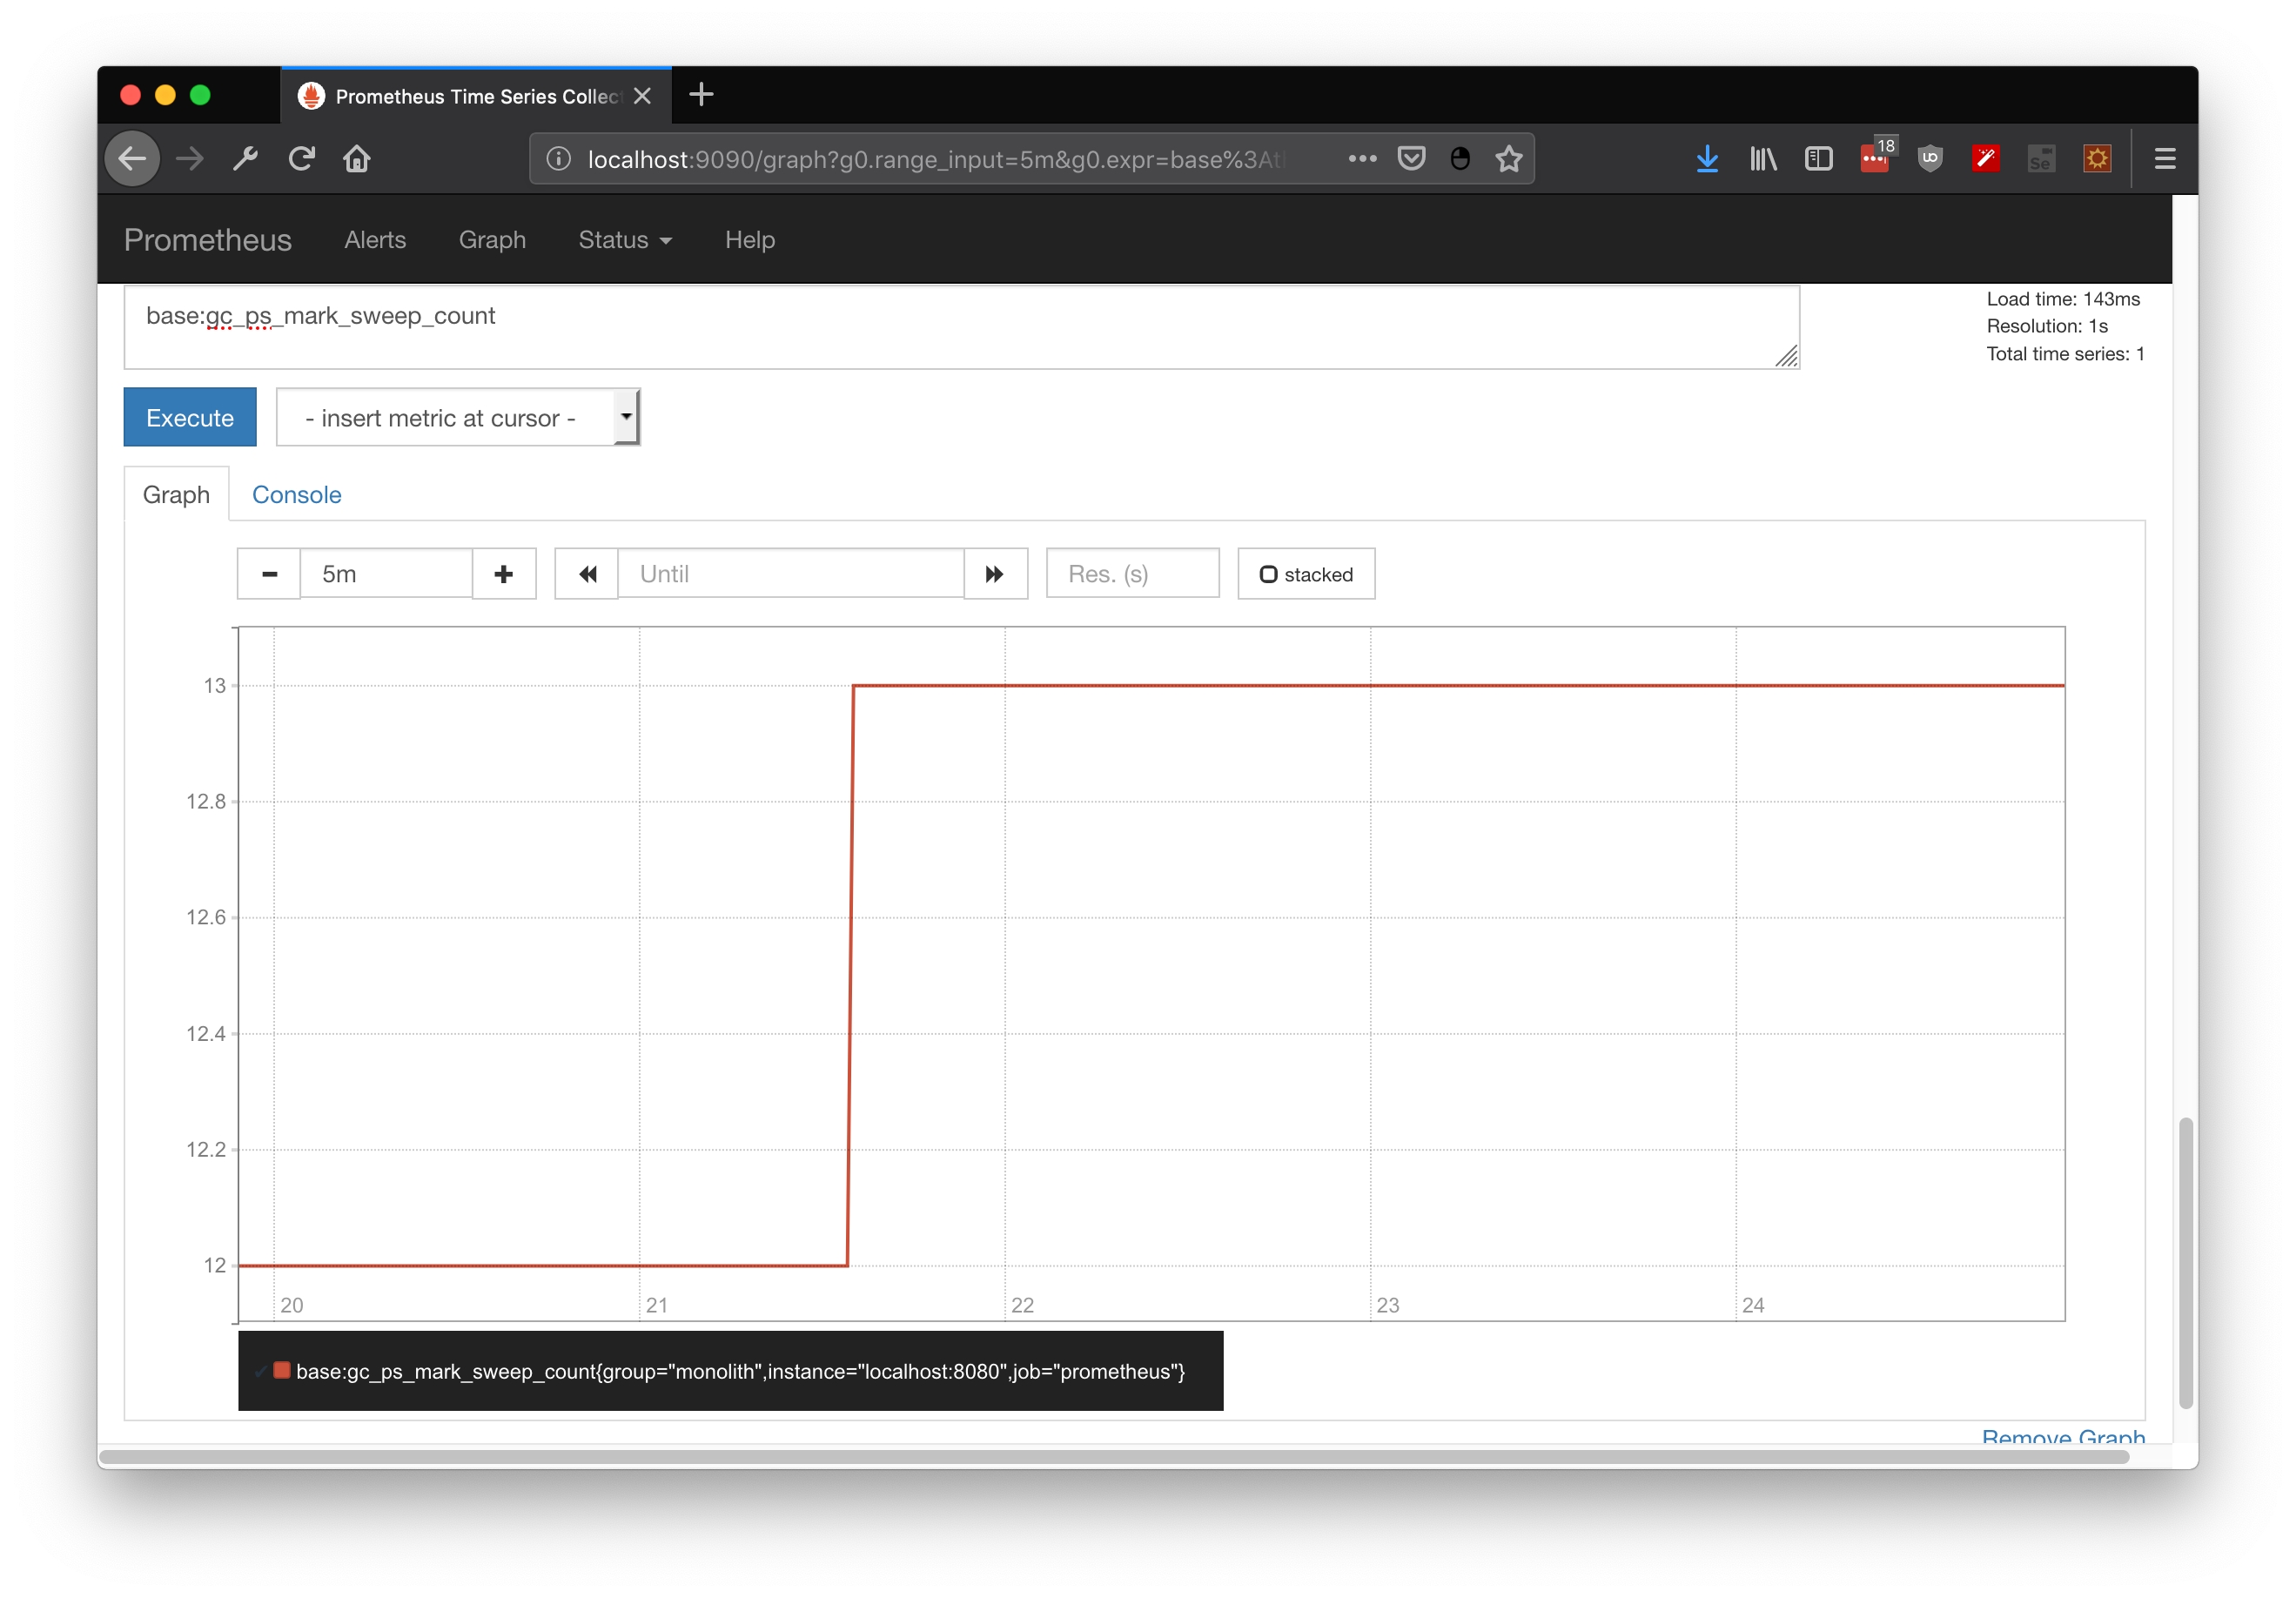
By itself metrics are just an up to date snapshot about platform state. If you wanna compare these snapshots over time, metrics should be retrieved on constant periods of time . . . or you could integrate prometheus which already does it for you. In here I demonstrate some useful querys for JVM state, including heap state, cpu utilization and GC executions:
base:memory_used_heap_bytes
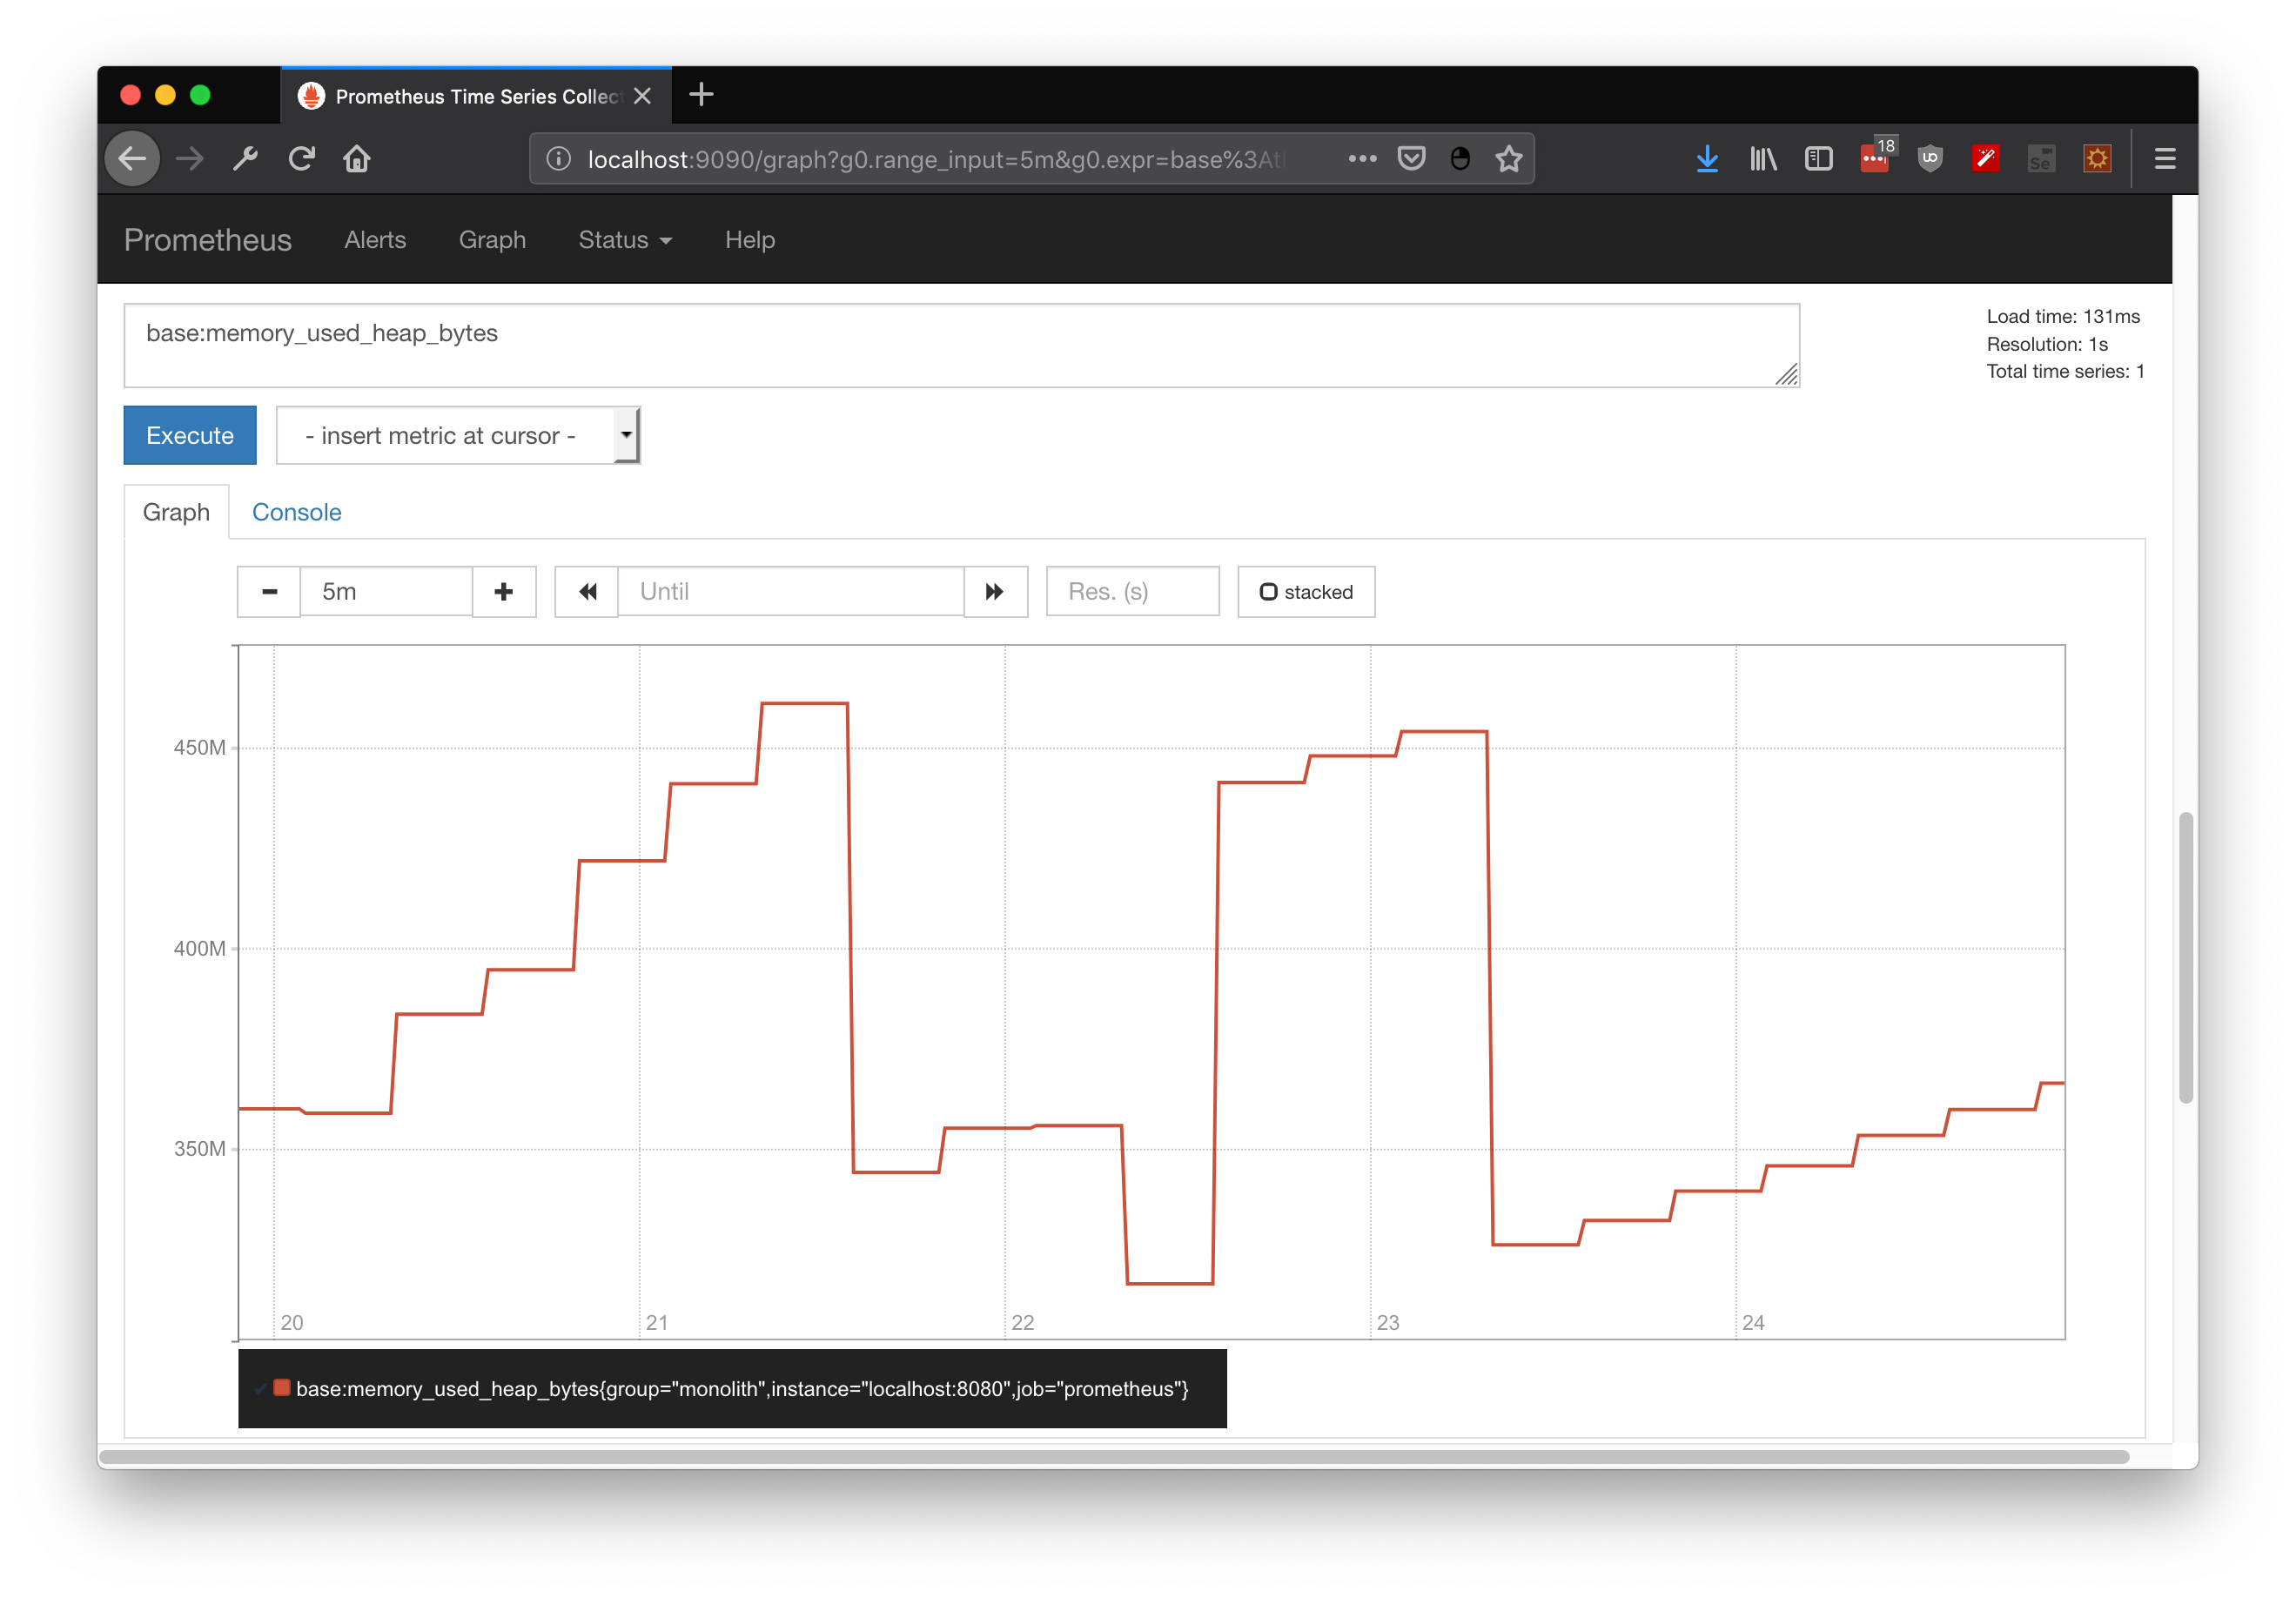
base:cpu_system_load_average
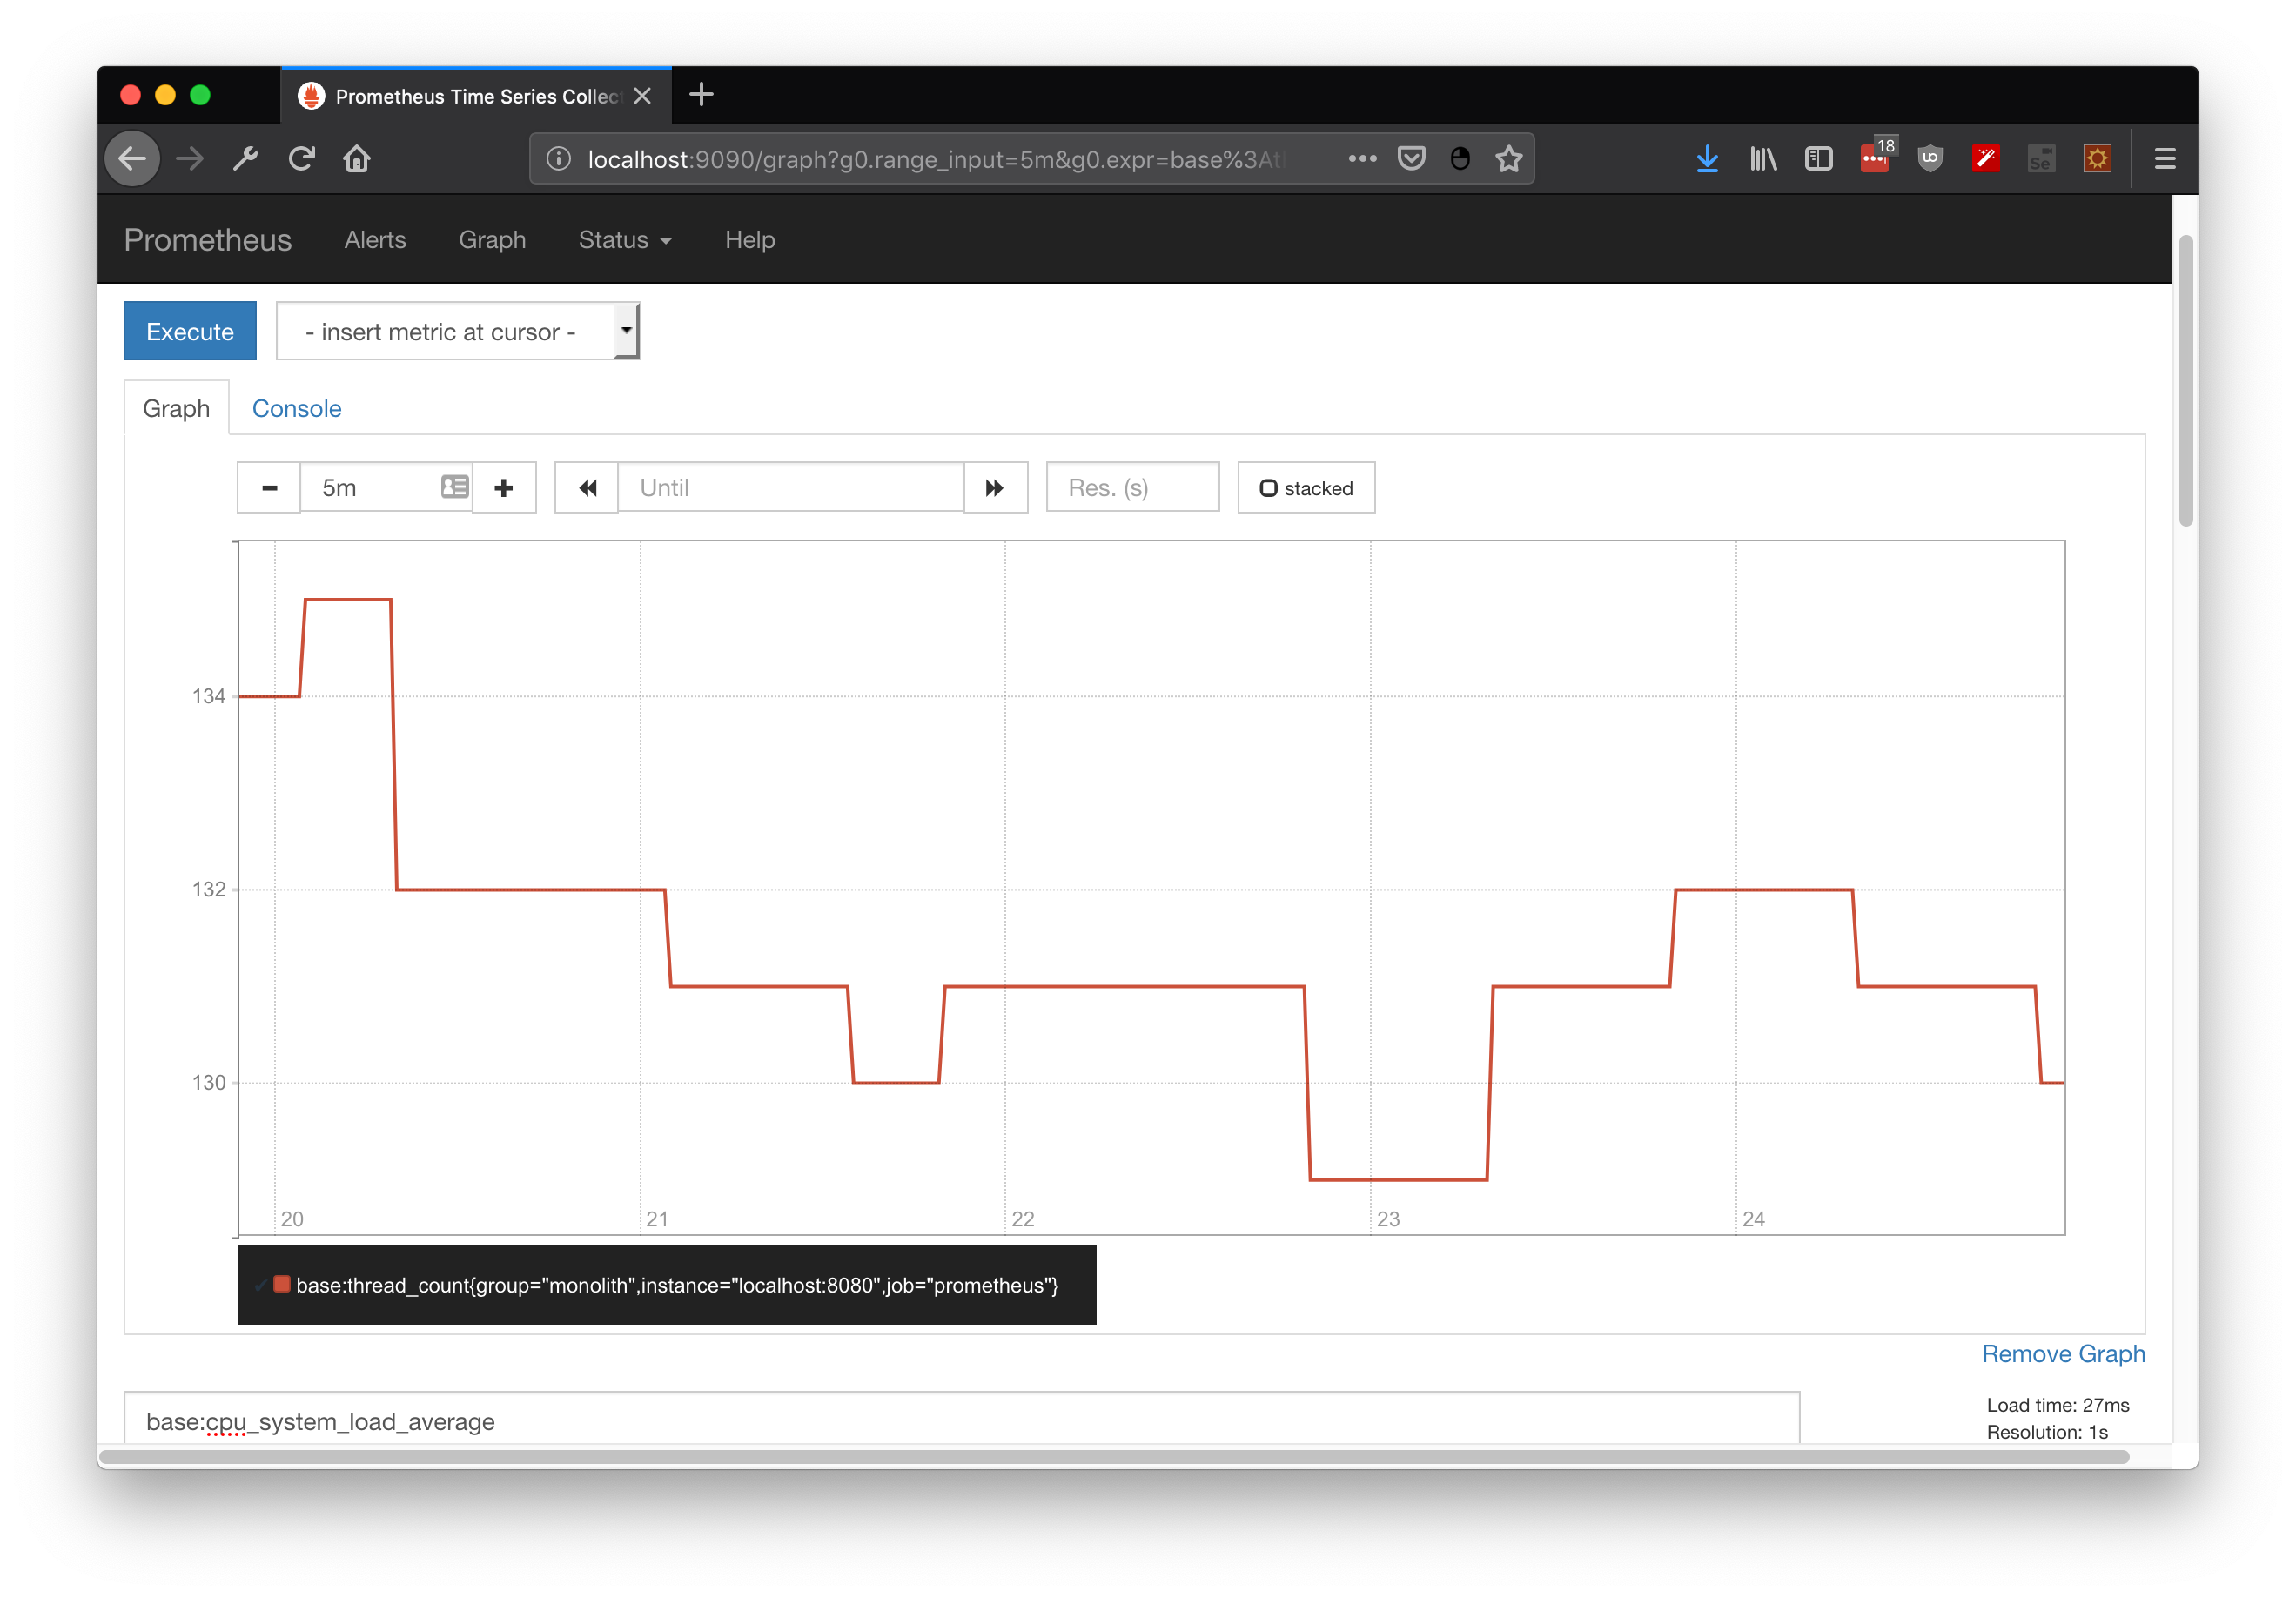
base:gc_ps_mark_sweep_count
Case 1: Metrics for Microservices
In a regular and "full tolerant" request from one microservice to another your communication flow will go through the following decisions:
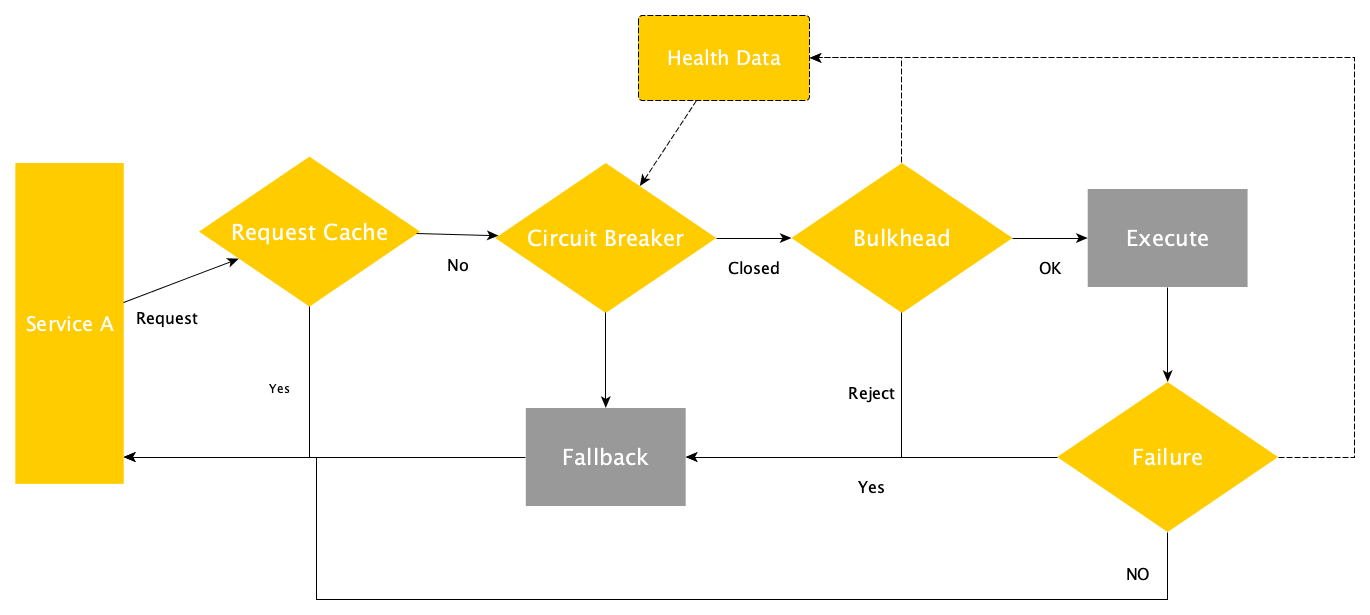
- To use or not a cache to attend the request
- To cut the communication (circuit breaker) and execute a fallback method if a metric threshold has been reached
- To reject the request if a bulkhead has been exhausted and execute a fallback method instead
- To execute a fallback method if the execution reached a failed state
Many of the caveats on developing Microservices come from the fact that you are dealing with distributed computation, hence you should include new patterns that already depend on metrics. If metrics are being generated, with exposure you will gain data for improvements, diagnosis and issue management.
Case 1.1: Counted to retrieve failed hits
The first metric to implement will be Counted, a pretty simple one actually. Its main objective is to increment/decrement its value over time. In this use case the metric is counting how many times the service reached the fallBack alternative by injecting it directly on a JAX-RS service:
@Inject
@Metric
Counter failedQueries;
...
@GET
@Path("/{id:[a-z]*[0-9][0-9]*}")
@Fallback(fallbackMethod = "findByIdFallBack")
@Timeout(TIMEOUT)
public Response findById(@PathParam("id")
final String imdbId) {
...
}

public Response findByIdFallBack(@PathParam("id")
final String imdbId) {
	...
	failedQueries.inc();
}
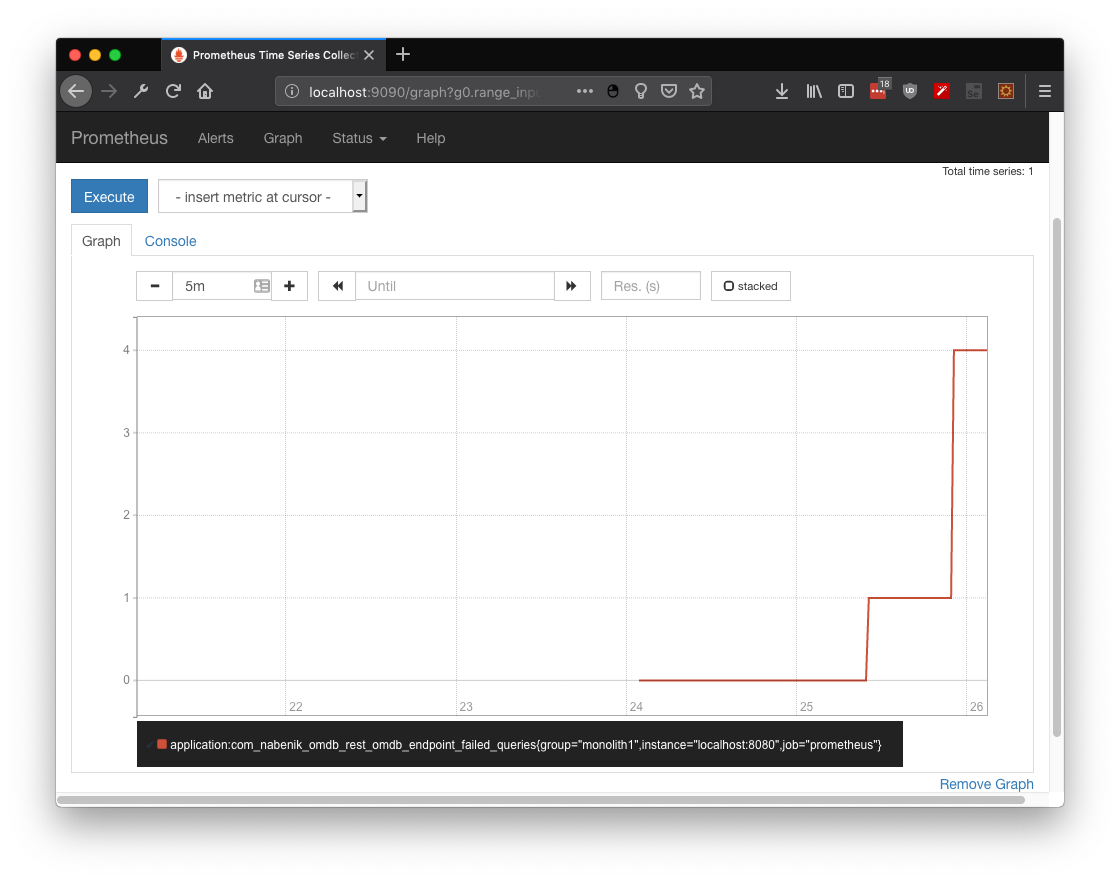
After simulating a couple of failed queries over OMDB database (no internet :) ) the metric application:com_nabenik_omdb_rest_omdb_endpoint_failed_queries shows how many times my service has invoked the fallback method:
Case 1.2: Gauge to create your own metric
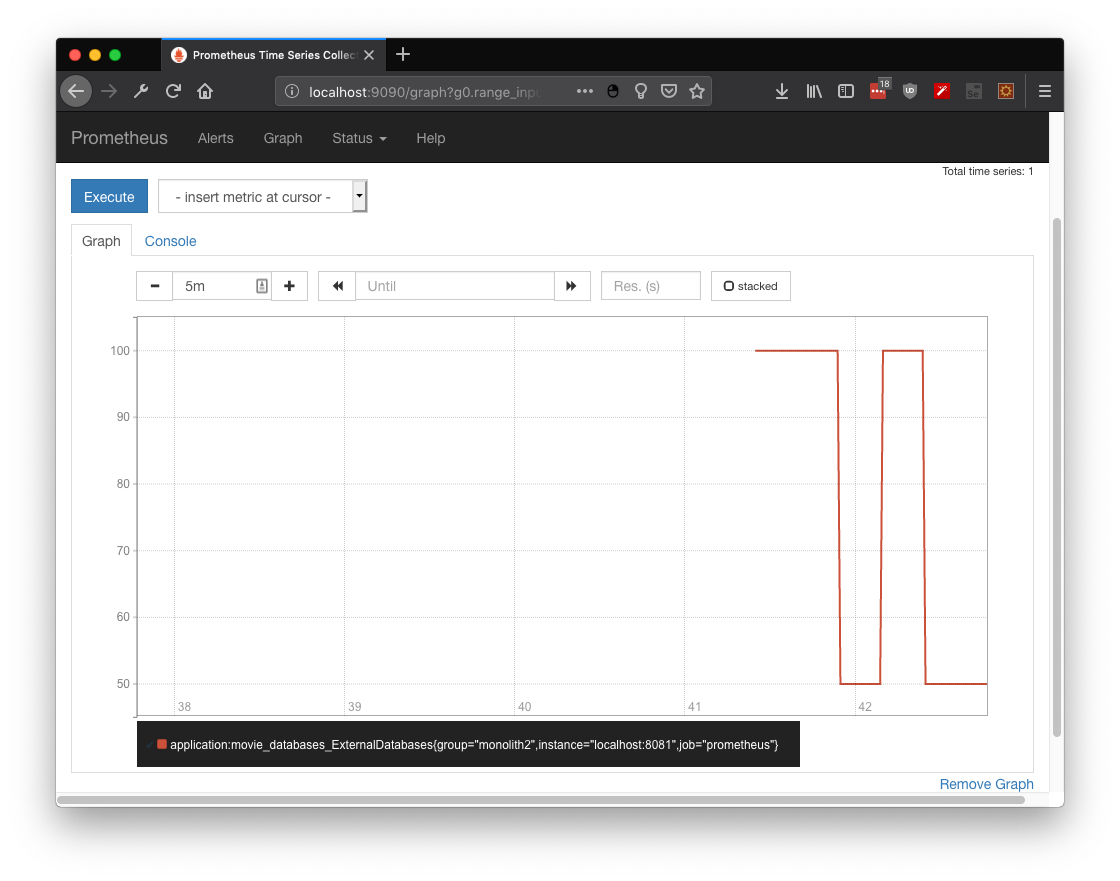
Although you could depend on simple counters to describe the state of any given service. With gauge you could create your own metric . . . like a dummy metric to display 100 or 50 depending on odd/even random number:
@Gauge(unit = "ExternalDatabases", name = "movieDatabases", absolute = true)
public long getDatabases() {
	int number = (int)(Math.random() * 100);
	int criteria = number % 2;

	if(criteria == 0) {
		return 100;
	}else {
		return 50;
	}
}
Again, you could search for the metric at prometheus, specifically application:movie_databases_ExternalDatabases
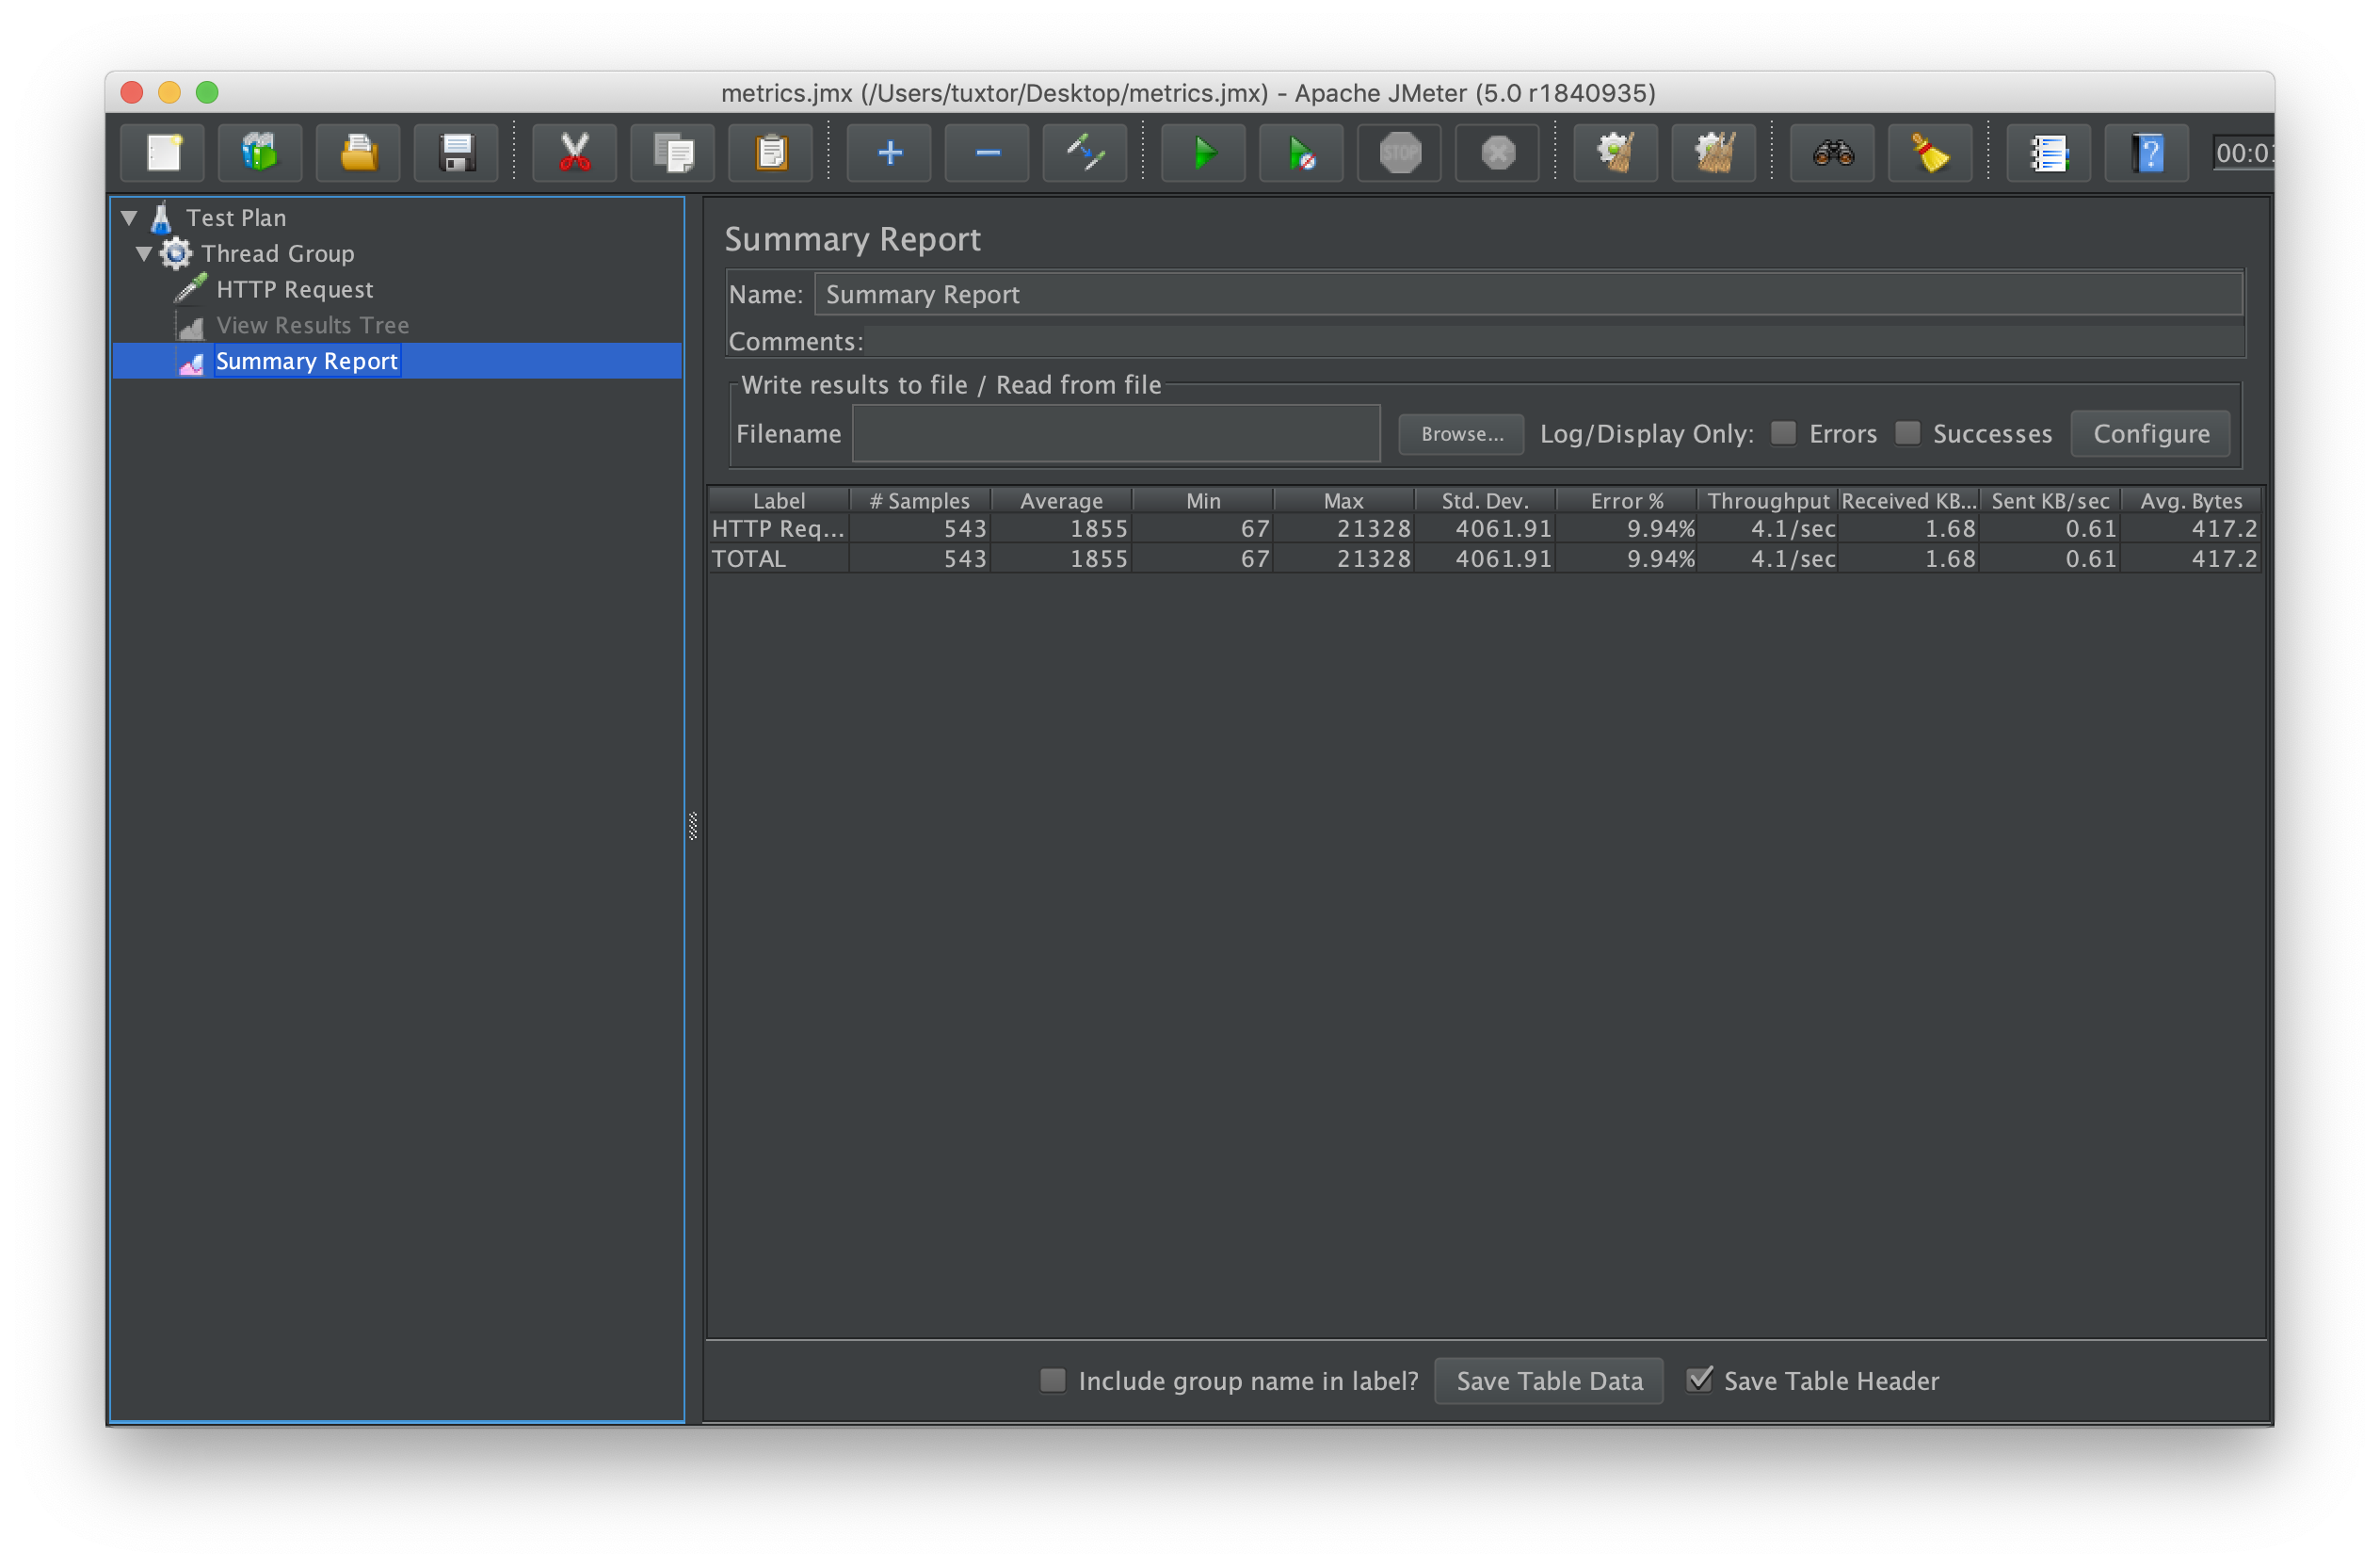
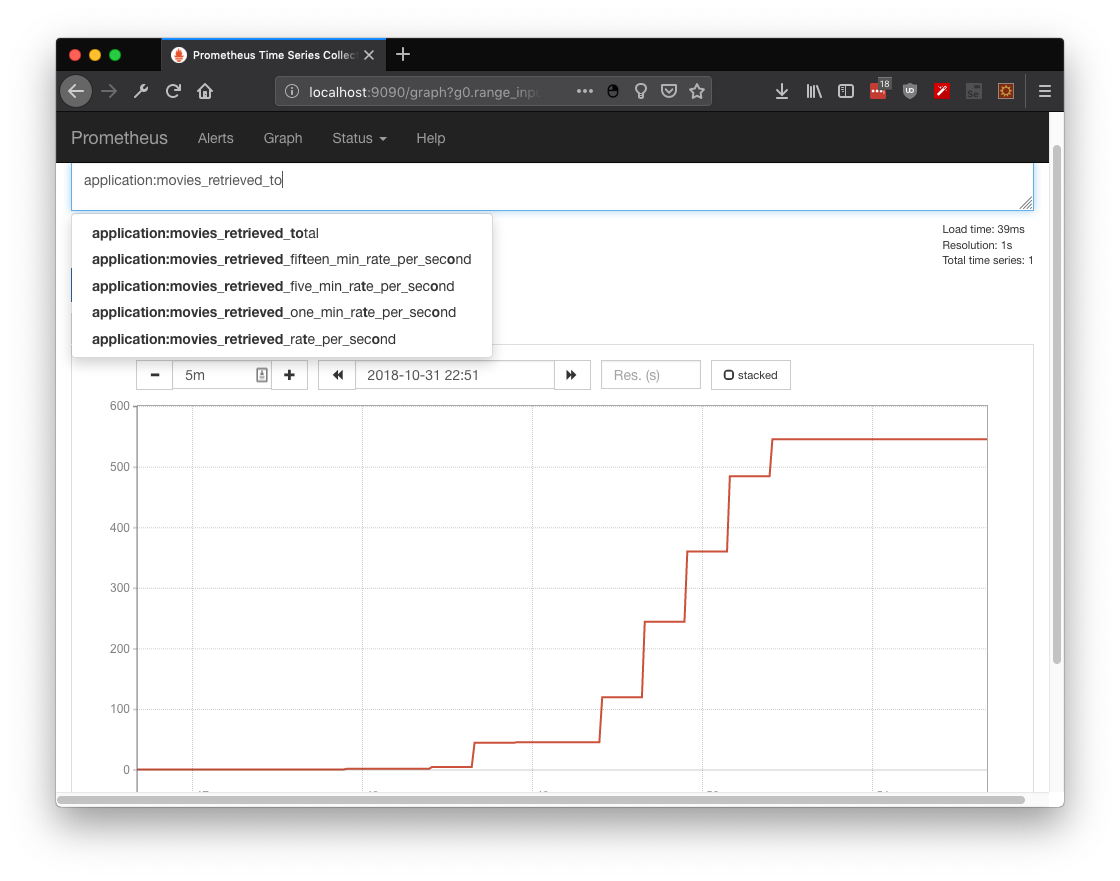
Case 1.3: Metered to analyze request totals
Are you charging your API per request? Don't worry you could measure the usage rate with @Metered.
@Metered(name = "moviesRetrieved",
	unit = MetricUnits.MINUTES,
	description = "Metrics to monitor movies",
	absolute = true)
public Response findExpandedById(@PathParam("id") final Long id)
In this practical use case 500 +/- requests where simulated over a one minute period. As you could observe from the metric application:movies_retrieved_total the stress test from JMeter and Prometheus show the same information:
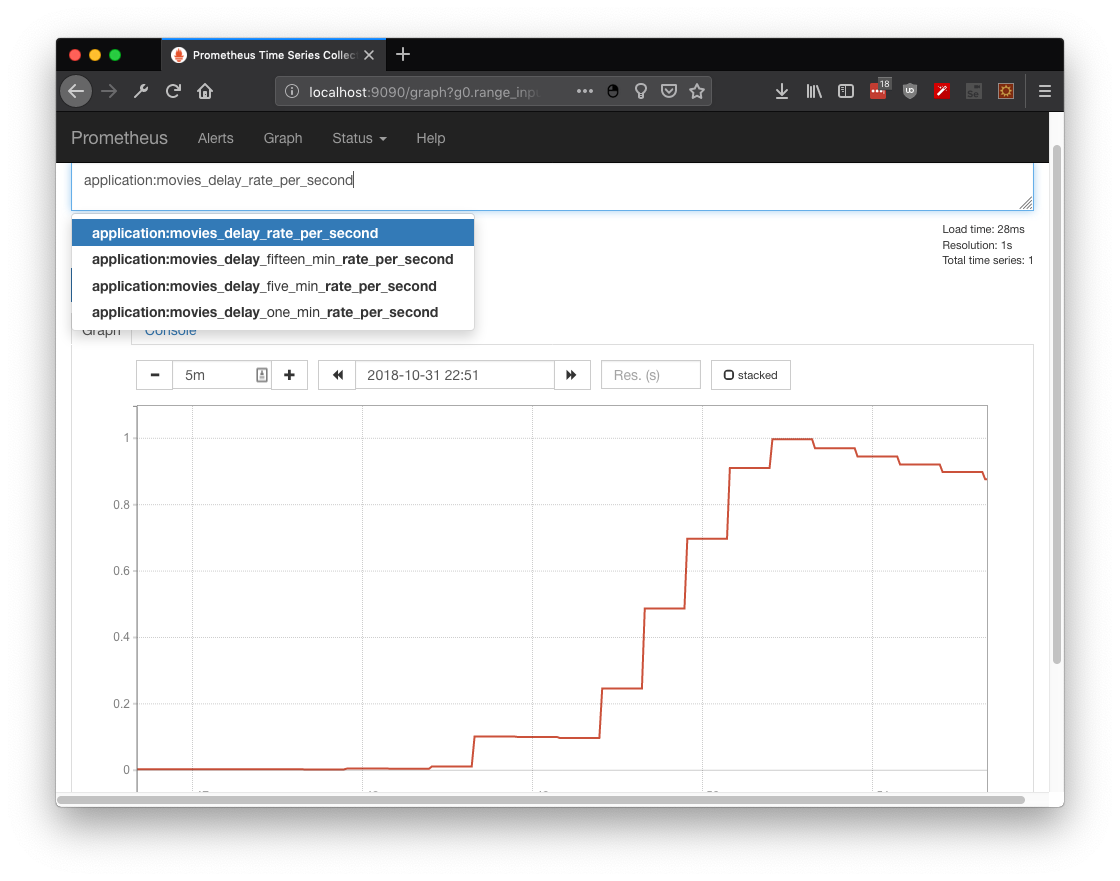
Case 1.4: Timed to analyze your response performance
If used properly, @Timed will give you information about requests performance over time units.
@Timed(name = "moviesDelay",
	description = "Metrics to monitor the time for movies retrieval",
	unit = MetricUnits.MINUTES,
	absolute = true)
public Response findExpandedById(@PathParam("id") final Long id)
By retrieving the metric application:movies_delay_rate_per_second its observable that requests take more time to complete at the end of the stress test (as expected with more traffic, less bandwidth and more time to answer):
Case 1.5: Histogram to accumulate useful information
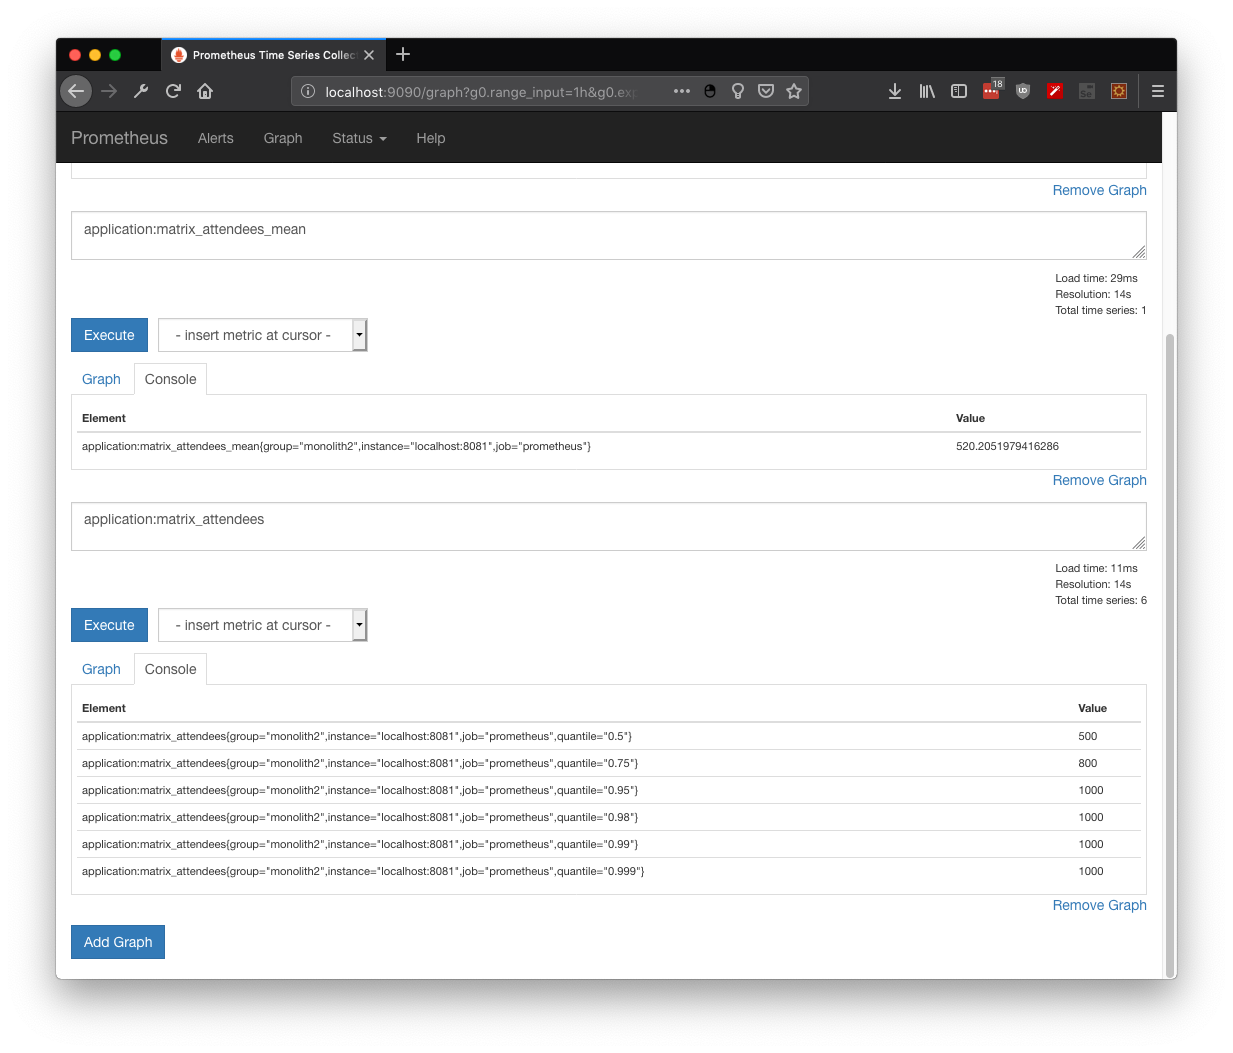
As described in Wikipedia, an Histogram is an accurate representation of the distribution of numerical data. Hence we could create our own distribution by manipulating directly the metrics API with any given data, like global attendees:
@Inject
MetricRegistry registry;

@POST
@Path("/add/{attendees}")
public Response addAttendees(@PathParam("attendees") Long attendees) {
	Metadata metadata =
	new Metadata("matrix attendees",
	MetricType.HISTOGRAM);
	Histogram histogram =
	registry.histogram(metadata);
	histogram.update(attendees);
	return Response.ok().build();
}
And as any distribution, we could get the mins, max, average and values per quantile: